Tracked UK delivery, 2 to 3 working days

How many calories are in peas?

66.4kcal

in an 80 g portion

83 kcal per 100 g.

Source: UK CoFID 2021, record 13-438. Checked 5 October 2026.

1.2 gFat

5.5 gProtein

4.2 gFibre

54 %Daily thiamin

Peas, raw

What’s in an 80 g portion

More than half of a portion is water, which is why the calories stay low. What is left is mostly carbohydrate.

  • 1.2 gFat
  • 5.5 gProtein
  • 9 gCarbohydrate
  • 4.2 gFibre
  • 59.7 gWater
  • 0.3 gMinerals and the rest

Above average for vegetables

Peas are 83 kcal per 100 g. The 240 vegetables in this database average 59.9.

Peas83
Vegetables average59.9

Low in sugar, almost no salt

Low sugars and very low salt by UK labelling rules, per 100 g.

Sugars, per portion1.8 g
Salt, per portion0 g

Vitamins and minerals in peas

Four of the 23 reach the “high in” level, led by thiamin.

54 %

Thiamin (vitamin B1)

0.59 mg in an 80 g portion

2nd of 229 vegetables

Thiamin contributes to normal energy-yielding metabolism, to the normal function of the heart and to normal psychological function.

Vitamin K0.0312 mg42 %
Folate0.0496 mg25 %
Vitamin C19.2 mg24 %
Iron2.2 mg16 %

A source of

Only a trace

  • Selenium

None recorded

  • Vitamin D
  • Vitamin B12
Show all 23 with amounts
Thiamin (vitamin B1)0.59 mg, 54 %
Vitamin K0.0312 mg, 42 %
Folate0.0496 mg, 25 %
Vitamin C19.2 mg, 24 %
Niacin (vitamin B3)2.9 mg, 18 %
Iron2.2 mg, 16 %
Manganese0.32 mg, 16 %
Phosphorus104 mg, 15 %
Potassium264 mg, 13 %
Zinc0.88 mg, 8.8 %
Magnesium27.2 mg, 7.3 %
Vitamin B60.1 mg, 6.9 %
Vitamin A0.04 mg, 5 %
Copper0.04 mg, 4 %
Chloride31.2 mg, 3.9 %
Calcium16.8 mg, 2.1 %
Pantothenic acid (vitamin B5)0.12 mg, 2 %
Vitamin E0.17 mg, 1.4 %
Riboflavin (vitamin B2)0.02 mg, 1.1 %
Iodine0.0016 mg, 1.1 %
Biotin0.0004 mg, 0.8 %
Vitamin Dnone recorded
Vitamin B12none recorded

Badges use the UK legal thresholds per 100 g: 15 % of the reference intake for “source of”, 30 % for “high in”. A trace is shown as “trace” and never counts.

What peas don’t give you. And where to find it.

No recorded vitamin D, selenium or vitamin B12.
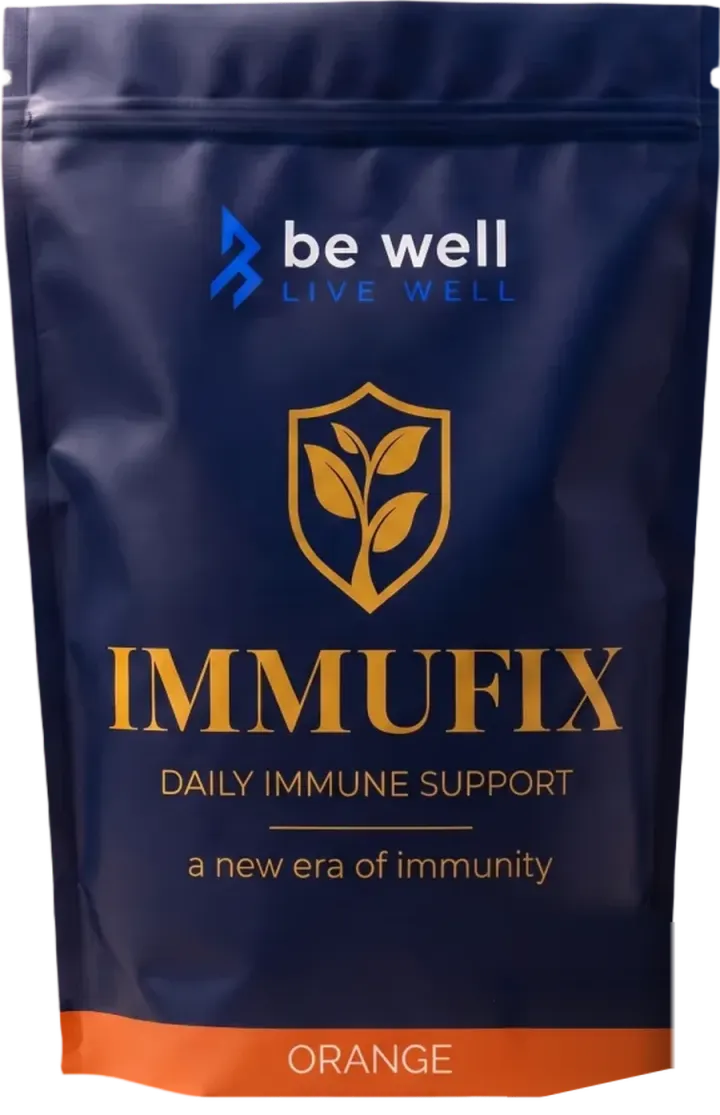
Immufix Daily Immune Support pouch, orange flavour

100 mgVitamin C, 125 %

0.075 mgSelenium, 136 %

0.00125 mgVitamin D, 25 %

Or one scoop of Immufix

Every 25 g scoop declares 100 mg of vitamin C, 0.00125 mg of vitamin D and 0.075 mg of selenium, alongside other vitamins and minerals. Vitamin C, vitamin D and selenium contribute to the normal function of the immune system.

30-day money-back on your first pouch. 75 kcal and 9.9 g of sugars a scoop.

Try your first pouch

30-day money-back guarantee on your first qualifying pouch, less £10 shipping and handling.

Tracked UK delivery

Free standard delivery to UK addresses. Royal Mail 48 tracked, usually 2 to 3 working days.

Made in Cambridgeshire

Made in the UK since 1998, with every nutrient and its declared amount listed on the label.

Peas against other vegetables

Per 100 g, peas have the most thiamin of the 6 here, ahead of peas (split, dried, raw).

Peas, rawthis page
Peas, split, dried, raw−0 mg
Broccoli, green, steamed−0.5 mg
Parsnip, raw−0.5 mg
Onions, dried, raw−0.5 mg
Rocket, raw−0.6 mg

All values per 100 g, from the same dataset. Differences are against peas.

Paula Radcliffe
Since that first introduction in 1998, Immufix has remained a constant in my life.

Paula Radcliffe, ambassador and co-owner. Read her story

Taken every morning since 1998.

Paula Radcliffe has taken the same formula since she was 24. Customers rate Immufix 4.8 out of 5 from 89 reviews.

2:15:25World record, 2003
28Years, same routine
6London and New York wins

Questions about peas

What the numbers say to the questions people actually search.

How many calories are in a portion of peas?
A typical portion (80 g, one of your five a day) gives 66 kcal. Per 100 g the figure is 83 kcal.
Is peas high in thiamin?
Yes. Peas, raw have 0.74 mg thiamin per 100 g, 67 % of the NRV, above the 30 % threshold for a “high in” claim.
Which vitamins and minerals do peas have most of?
By share of the daily reference intake: thiamin (0.74 mg, 67 %), vitamin K (0.039 mg, 52 %) and folate (0.062 mg, 31 %) per 100 g.
Are peas a good source of protein?
Peas, raw have 6.9 g protein per 100 g, 29 % of the energy, which meets the UK threshold for “high protein”.
How these numbers were made
Every figure comes from the UK Composition of Foods Integrated Dataset (CoFID), 2021 edition, record 13-438, Peas, raw, published by Public Health England under the Open Government Licence v3.0. Main data references: IFR, The nutritional composition of retail vegetables in the UK, 1984-1987; and Fatty Acid Supplement (1998) 13-864. Vitamin K1 from Bolton-Smith et al Br.J. Nutr.83, 2000. Values are per 100 g of the edible part; a portion is 80 g, one of your five a day, the usual UK portion for vegetables. Edible proportion: 37 % of the weight as bought is eaten. Reference intakes follow Regulation (EU) 1169/2011 Annex XIII as retained in GB law; “source of”, “high in” and “low” follow Regulation (EC) 1924/2006, assessed per 100 g. Function lines are the authorised wording from the GB register of nutrition and health claims, credited to the nutrient. Energy is rounded to the whole kcal and kJ; other amounts to one decimal, or two below 1. A trace is shown as “trace” and never gets a figure or a badge; a nutrient never analysed is left off the page. We start from the dataset’s 2,887 records and keep 2,322: records weighed with bone, shell or skin, alcoholic drinks, infant foods, brand-named products, records with fewer than eight measured vitamins and minerals and near-identical variants are left out. Group context uses the 240 vegetables kept from the dataset; a rank counts only the foods with a measured figure for that nutrient. Food images are illustrations from Ingredient Atlas, released under CC0; they show the food, not the measured sample. Checked 5 October 2026. Contains public sector information licensed under the Open Government Licence v3.0.

Nutrition

Peas, raw

Calories66.4 kcal
Fat
1.2 g
of which saturates
0.45 g
Carbohydrate
9 g
of which sugars
1.8 g
of which starch
5.6 g
Fibre
4.2 g
Protein
5.5 g
Salt
0 g

Vitamins and minerals

Thiamin (vitamin B1)
0.59 mg
Vitamin K
0.0312 mg
Folate
0.0496 mg
Vitamin C
19.2 mg
Niacin (vitamin B3)
2.9 mg
Iron
2.2 mg

275 kJ per portion. Values for the edible portion. Source: UK CoFID 2021.

All 23 vitamins and minerals